

Quality management has become essential for businesses globally, with a significant focus on customer satisfaction, process improvement, and reducing defects. According to a report, 5%-30% of revenue is lost due to poor quality in manufacturing. But there is hope, and it lies in effective quality management tools. The “7QC Tools,” originating from Japan, have stood the test of time as fundamental instruments in Total Quality Management (TQM). In this article, we will break down these seven tools, showing you their purpose and how to use them for quality improvement.

Overview of the 7QC Tools
The 7QC tools are practical instruments designed for efficient problem-solving. They are:
- Pareto Chart
- Cause-and-Effect Diagram (Fishbone/Ishikawa)
- Check Sheet
- Histogram
- Control Chart
- Scatter Diagram
- Flowchart
These tools are often used together to identify, analyze, and solve quality-related issues within an organization.
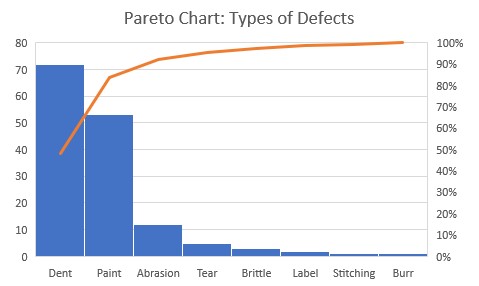
Tool 1: Pareto Chart Definition and Purpose
Named after the economist Vilfredo Pareto, the Pareto Chart is based on the 80/20 rule, which suggests that 80% of problems stem from 20% of causes. It’s used to prioritize problems based on their frequency or impact.
How It Works: Follow the below steps to create a Pareto Chart:
| Step | Action |
|---|---|
| 1 | Identify the problems to analyze (e.g., defects, delays). |
| 2 | Collect data on each problem’s frequency or cost. |
| 3 | Sort the problems in descending order of impact. |
| 4 | Calculate cumulative percentages. |
| 5 | Create a bar chart, adding a cumulative line graph to indicate the cumulative percentage of problems addressed. |
| 6 | Analyze the chart to identify the problems causing the majority of issues. |
Application: By prioritizing major issues, businesses can focus resources on addressing root causes effectively.
Quote: “Problems are nothing but wake-up calls for creativity.” – Gerhard Gschwandtner, founder of Selling Power.
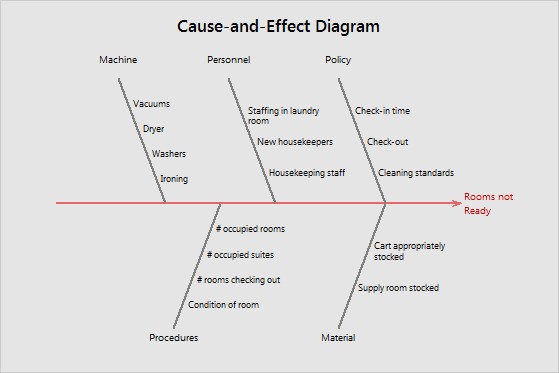
Tool 2: Cause-and-Effect Diagram (Ishikawa/Fishbone Diagram)
Definition and Purpose: Developed by Dr. Kaoru Ishikawa, this diagram visualizes the potential causes of a problem to identify its root cause.
How It Works: Here’s how to create a Fishbone Diagram:
| Step | Action |
|---|---|
| 1 | Define the problem clearly. |
| 2 | Draw the “spine” of the diagram and add the “effect” (problem) at the end of the spine. |
| 3 | Add “bones” representing major categories of potential causes, like Methods, Manpower, Materials, and Machines. |
| 4 | Identify specific causes within each category by brainstorming with a team. |
| 5 | Draw branches from each category to represent these causes. |
| 6 | Analyze the diagram to identify the primary root cause(s) contributing to the problem. |
Application: Useful in uncovering hidden relationships between potential causes and their effects on business problems.
Quote: “Quality means doing it right when no one is looking.” – Henry Ford, founder of Ford Motor Company.
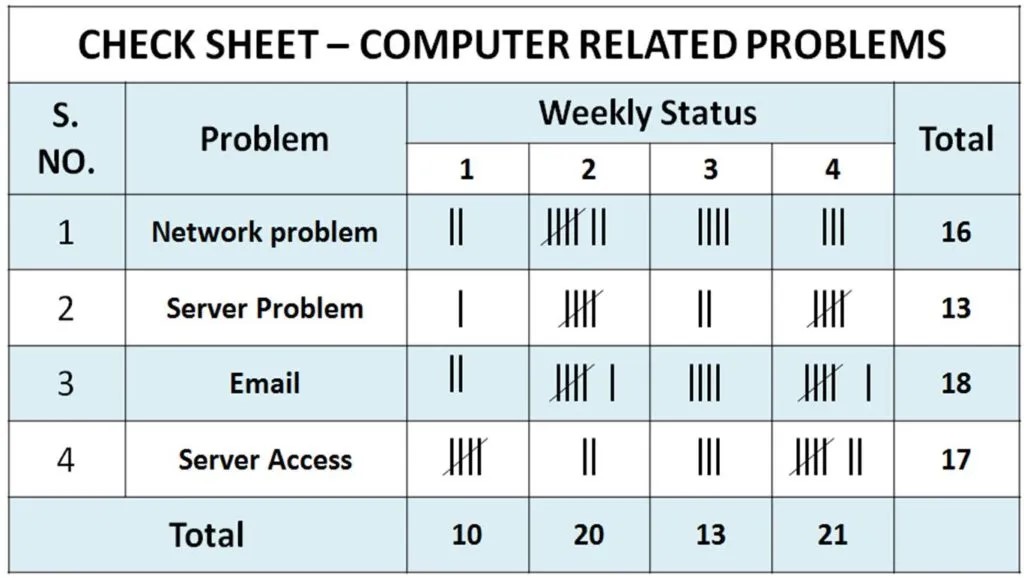
Tool 3: Check Sheet
Definition and Purpose: Check sheets simplify data collection, enabling organizations to capture information consistently.
How It Works: Create an effective Check Sheet with these steps:
| Step | Action |
|---|---|
| 1 | Clearly define what data to collect (e.g., defects, machine downtime). |
| 2 | Design the check sheet to include categories or criteria that need to be measured. |
| 3 | Train personnel on how to use the check sheet properly. |
| 4 | Collect data over a specified period. |
| 5 | Review the completed sheets to find patterns or trends. |
Application: They are particularly useful in tracking repetitive defects, survey responses, and quality audits.
Quote: “A good system shortens the road to the goal.” – Orison Swett Marden, founder of Success magazine.
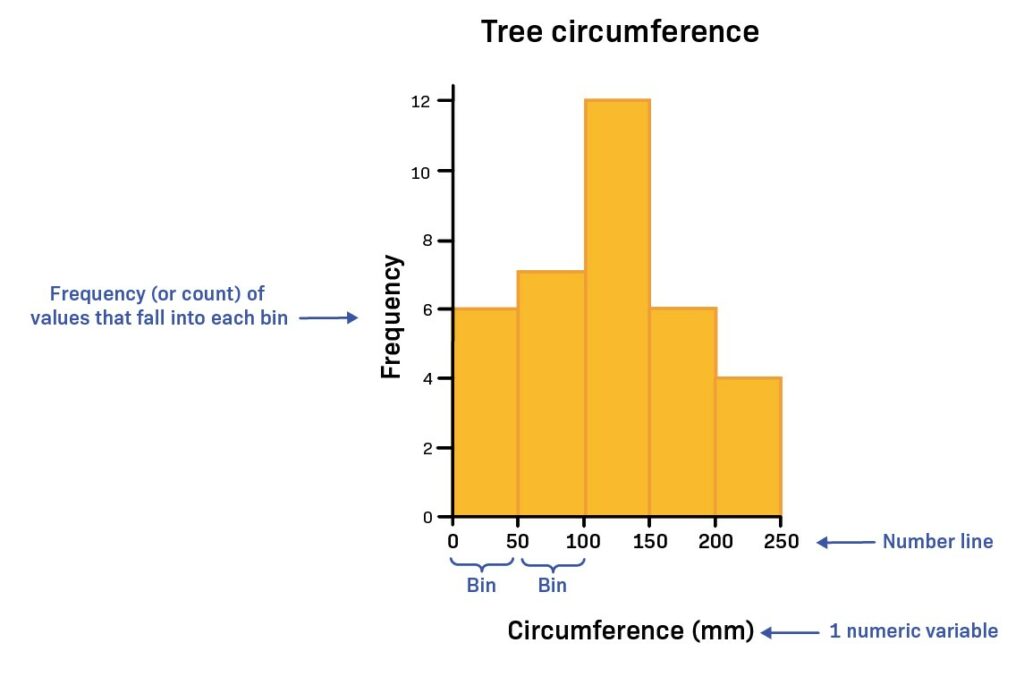
Tool 4: Histogram Definition and Purpose
A histogram shows the distribution of data points, helping identify patterns or anomalies.
How It Works: Construct an accurate histogram by following these steps:
| Step | Action |
|---|---|
| 1 | Collect and categorize data into ranges (bins). |
| 2 | Determine the range and number of bins required. |
| 3 | Plot the frequency of data points in each bin as bars on the graph. |
| 4 | Label the axes with appropriate scales. |
| 5 | Analyze the histogram for patterns, skewness, and outliers. |
Application: Useful in determining process capability and distribution characteristics.
Quote: “Statistics are like a bikini. What they reveal is suggestive, but what they conceal is vital.” – Aaron Levenstein, business professor.
Tool 5: Control ChartDefinition and Purpose
Walter Shewhart developed control charts to distinguish between normal and abnormal process variation.
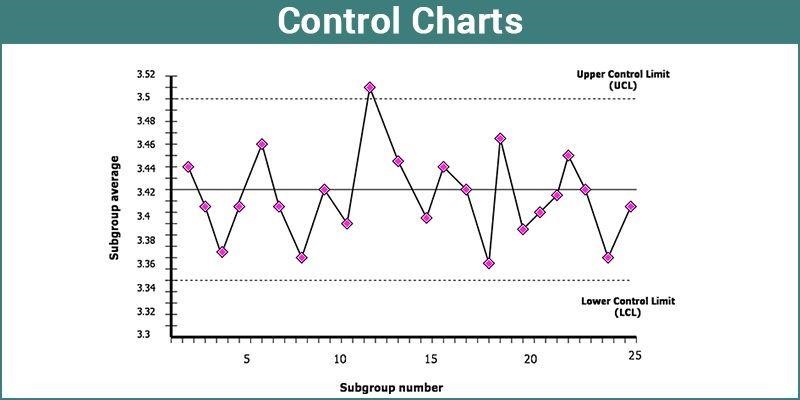
How It Works: Construct a Control Chart by following these steps:
| Step | Action |
|---|---|
| 1 | Select a measurable parameter to monitor. |
| 2 | Collect initial data to establish control limits. |
| 3 | Calculate the upper and lower control limits (typically ±3 standard deviations from the mean). |
| 4 | Plot data points over time to identify trends. |
| 5 | Add the control limits to the chart to see if any points fall outside these limits. |
| 6 | Investigate points that lie outside the control limits or show patterns of non-random variation. |
Application: Helps in detecting and correcting process issues before they result in significant defects.
Quote: “If you can’t measure it, you can’t improve it.” – Peter Drucker, management consultant.
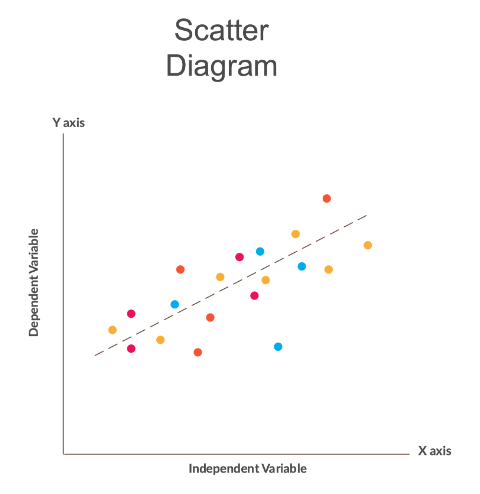
Tool 6: Scatter Diagram
Definition and Purpose: Scatter diagrams depict relationships between two variables to identify correlations.
How It Works: To create a Scatter Diagram, follow these steps:
| Step | Action |
|---|---|
| 1 | Choose two variables to study. |
| 2 | Collect paired data points for the variables. |
| 3 | Plot data points on a graph with one variable on each axis. |
| 4 | Label the axes with appropriate units and ranges. |
| 5 | Analyze the plotted points to see if a trend or pattern emerges. |
Application: Helps visualize correlations between inputs and outputs in process improvement efforts.
Quote: “In God we trust. All others must bring data.” – W. Edwards Deming, quality management expert.
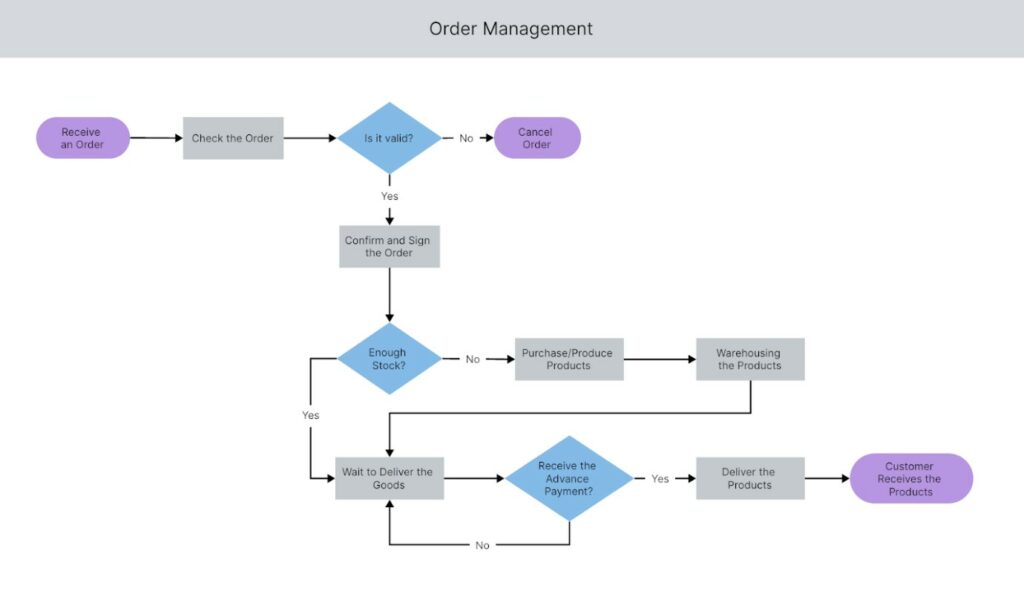
Tool 7: FlowchartDefinition and Purpose
Flowcharts map out a process step by step to identify areas for improvement.
How It Works: Create a Flowchart by following these steps:
| Step | Action |
|---|---|
| 1 | Define the starting point of the process. |
| 2 | List the key steps in the process in logical order. |
| 3 | Use standard symbols to represent each step, decision, or action. |
| 4 | Draw arrows to indicate the flow between steps. |
| 5 | Validate the flowchart with stakeholders to ensure accuracy. |
| 6 | Analyze the chart to find bottlenecks or areas of inefficiency. |
Application: Helps streamline processes by revealing redundant or non-value-added steps.
Quote: “Efficiency is doing things right; effectiveness is doing the right things.” – Peter Drucker, management consultant.
Conclusion
In summary, the 7QC tools form the cornerstone of effective quality management. Individually, each tool provides valuable insights, but when used together, they create a comprehensive approach to problem-solving. As organizations strive to improve efficiency and minimize defects, the 7QC tools will remain indispensable. The next step is to integrate these tools into your quality initiatives and pair them with emerging trends like Lean and Six Sigma to stay ahead in the ever-evolving business landscape.
To learn about these 7 QC tools, knowing the underlying principles of Lean and Six Sigma through various certification training programs for top governing bodies like ASQ, IASSC, EXIN, and more is critical. Lean Six Sigma Yellow Belt Training, Lean Six Sigma Green Belt training, and Lean Six Sigma Black Belt training provide comprehensive information on these quality control tools which help individuals and enterprise teams to provide products and services that are of exceptional quality for your customers worldwide.