Trending Now

Top 10 Project Scheduling Tools for PMP & PRINCE2 Aspirants (2026 Guide)
SIPOC Made Simple: How to Map a Process in 20 Minutes (with Examples)
PL-300 vs DP-600 vs DP-500 in 2026: Which Certification Should You Take First?
Portfolio Management Mastery: Why PfMP and PgMP Are Rising in Demand (2026)
How to Build a “Closed-Loop” CAPA System Using RCA (So Fixes Don’t Die in Docs)
Yellow Belt vs Green Belt vs Black Belt: Which Lean Six Sigma Level Should You Choose in 2026?
DMAIC Explained (2026): The Step-by-Step Method to Fix Any Process
PRINCE2 7 Tailoring Guide (2026): How to Adapt the Method for Any Project Size
Google Ads vs SEO in 2026: Which Should You Invest In First?
ITIL 5 Certification Demand and Job Market Trends: Complete Career Guide (2026)
Process Mining + Lean Six Sigma: The 2026 Playbook for Faster, Data-Driven DMAIC
CAPM vs PMP in 2026: Which Certification Should You Choose (and When)?
PRINCE2 7 Certification Path: Foundation → Practitioner → Next Steps (2026 Roadmap)
Oracle Primavera P6 Training Roadmap (2026): From Beginner to Project Controls Expert
AI Overviews & AI Mode SEO: How to Win Visibility When Google Answers First
RCA vs 5 Whys vs Fishbone vs 8D vs A3: When to Use Which (Decision Framework)
PL-300 Case Study Walkthrough: From Raw Data to Executive Dashboard (End-to-End)
ITIL 4 vs ITIL (Version 5): The Global, No‑Fluff Guide to What’s New, What Stays, and How to Transition
PRINCE2 7 Foundation: Complete Exam Guide, Format, Pass Mark, and Study Plan (2026)
Lean Six Sigma Yellow Belt: The 2026 Beginner Guide (Tools, Examples, Real Workplace Use)
Technical SEO Audit 2026: The Only Checklist That Still Matters
Content Refresh Strategy 2026: How to Update Old Pages for New Traffic
CAPM Exam Content Outline Explained: Domains, Weightage, and What to Study First
GA4 Setup Guide 2026: Step-by-Step for Accurate Tracking
From Keywords to Answers: How Search Works in 2026 
CAPM Certification 2026: The Complete Exam + Training Guide (PMI-Updated)
Traditional SEO vs Answer-First SEO: What Actually Ranks in 2026
ITSM Evolution: From Monolithic Systems to Cloud‑Centric Architectures (2026)
How to Run High-Performance Retargeting Campaigns Using AI
Project Leadership in 2026: Skills Every Successful Project Manager Needs
Technical SEO for 2026: Crawl Optimization, Log Analysis & AI Indexing Signals
Top 12 Project Management Mistakes and How to Avoid Them
PRINCE2® 7 (2026 Guide): What’s New, What Changed, and Why It Matters
Lean Six Sigma in 2026: What’s Changed (AI, Automation, Process Intelligence) & What Still Works
Root Cause Analysis in 2026: The Modern RCA Playbook for Faster, Repeatable Fixes
ITIL Is for Everyone and for Every Organization: A Deep‑Dive Playbook (2026)
Social Media Algorithms Explained (2026 Edition): What Actually Drives Reach Today
Power Query Best Practices 2026: Faster Refresh, Cleaner Models, Fewer Errors
PL-300 Exam Guide 2026: Skills Measured, Study Plan, and What’s Changed
LLMS.txt vs Robots.txt in 2026: What to Implement (and What to Avoid)
SEO in 2026: The Complete Playbook for AI Search, AEO & GEO
Google Ads Audits in 2026: A Step-by-Step Checklist to Fix Wasted Spend and Unlock Growth
AI-Driven Risk Management: Predict Risks Before They Happen
On-Page SEO 2026: New Techniques for Topical Relevance & AI Search
The Future of Project Management: Trends Reshaping 2025–2030 
Hybrid Project Management: Why Organizations Are Transitioning in 2026 and Beyond
AI-Powered Project Planning: Faster, Smarter, and More Accurate Strategies 
Industry Predictions for 2026: From GenAI to Value Streams and Total Experience
PMP vs CAPM vs PRINCE2: Which Certification Offers the Best ROI in 2026?
AI in Project Management: How Intelligent Tools Are Transforming PM Workflows 
Performance Max Mastery: How to Scale ROI with Smart Automation 
What is SAFe RTE? (Release Train Engineer)
SAFe RTE: The Complete Guide to Becoming a High-Impact Release Train Engineer (2025–2026)
Time Management: How to Turn Hours into Impact
Lean Six Sigma Green Belt: Skills, Value, Demand & Global Trends 2026
PL-300: Microsoft Power BI Data Analyst Certification for Career Growth Globally 2026
Strong & Sustained Demand for PMP Certification in 2026
Why Organizational Agility Matters: The Strategic Imperative for Big Enterprises
Building an Agility Culture Beyond IT Teams
How to Re-Engage Remote Teams: PMP Question on Motivation and Collaboration
Understanding Tuckman’s Team Development Stages - PMP Exam Question Explained
Why do Business Owners assign business value to team PI Objectives?  
Benefits of EXIN Agile Scrum Foundation Certification
Benefits of PMP Certification for Corporate and Individual Professionals in 2025
Streamlining Vaccine Development during a Global Health Crisis – An Imaginary PRINCE2 Case Study
PMBOK Guide Tips for Managing Change and Uncertainty in Projects
How to Apply PRINCE2 Methodologies in Real-World Projects
What is PRINCE2® 7? A Simple Explanation for Beginners
Project Management Certification in the United States of America
The Evolution of Project Management: From Process-Based to Principles-Based Approaches
Mastering ITIL and PRINCE2 for Enhanced Project Outcomes in Indian GCCs
Exploring the Eight Project Performance Domains in the PMBOK® Guide
PMI Best Practices for Project Management Across Different Environments
Your Ultimate Project Management Guide: Explained in Detail
Top Benefits of PRINCE2 for Small and Medium Enterprises
Best Project Management Certifications of 2025
The Importance of Tailoring PRINCE2 to Fit Your Organization's Needs
Resolve Slash URLs & Learn 301 vs. 308 Redirects Effectively
What is a standard change in ITIL 4?
Which practice provides a single point of contact for users?
What is the first step of the guiding principle 'focus on value'?
Which is a benefit of using an IT service management tool to support incident management?
A service provider describes a package that includes a laptop with software, licenses, and support. What is this package an example of?
What should be included in every service level agreement?
What are the two types of cost that a service consumer should evaluate?
The Business Case for SAFe®: Solving Modern Challenges Effectively
Which ITIL concept describes governance?
How does ‘service request management’ contribute to the ‘obtain/build’ value chain activity?
Which practice is the responsibility of everyone in the organization?
How Kaizen Can Transform Your Life: Unlock Your Hidden Potential
Unlocking the Power of SAFe®: Achieving Business Agility in the Digital Age
What is DevOps? Breaking Down Its Core Concepts
Which is a purpose of the ‘service desk’ practice?
Identify the missing word(s) in the following sentence.
Which value chain activity includes negotiation of contracts and agreements with suppliers and partners?
How does categorization of incidents assist incident management?
What is the definition of warranty?
Identify the missing word in the following sentence.
Which two needs should ‘change control’ BALANCE?
Which value chain activity creates service components?
Excel Formula for Data Analyst

Top MS Excel Functions For Data Analyst

Picture of Stefan Joseph
Stefan Joseph
Stefan Joseph is a seasoned Development and Testing and Data & Analytics, expert with 15 years' experience. He is proficient in Development, Testing and Analytical excellence, dedicated to driving data-driven insights and innovation.

MS Excel has always been a savior and it is almost the first love of every Data enthusiast. Though there are multiple Analytics tools available the spreadsheet program is one of the most essential things that every aspiring Data Analyst should learn. It’s not just about gathering data but also arranging them in a proper manner that looks neat and presentable. This article will help you with 5 such Excel formulae that you will need if you’re looking for a Data Analyst profession.

MS Excel Functions and Their Advantage

1. CONCATENATE

This is a simple one. Let’s say you have two or more cells and another column or row will be the merge or combination of those two cells. This way of merging those cells to get a combined one using a certain formula is called Concatenate. You can use a maximum of 255 strings or 8192 characters in a concatenate formula but you cannot use an array such as C1:C20. 

CONCATENATE formula excel

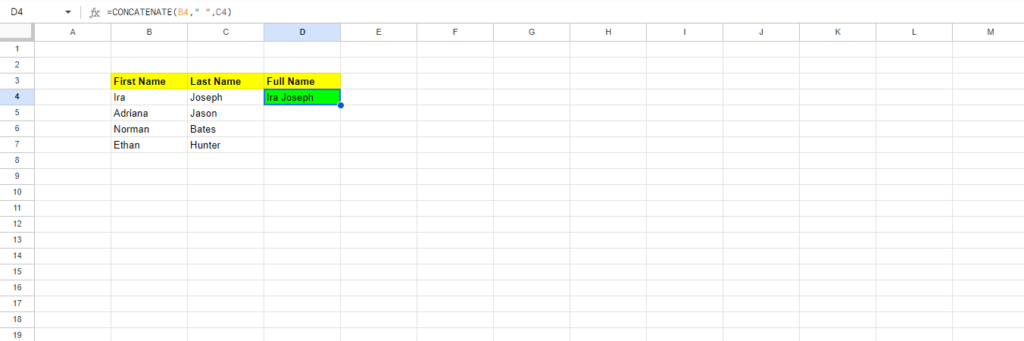
In this table, you can see that column B has the title ‘First Name’ and column C has ‘Last Name’. The next column D combines columns B and C and the title is ‘Full Name’. So combine the first and the last name using this formula:

=CONCATENATE(B4,” “,C4)

2. VLOOKUP

This formula works best when you want to search for any data that is arranged in a vertical column. 

VLOOKUP Excel Formula

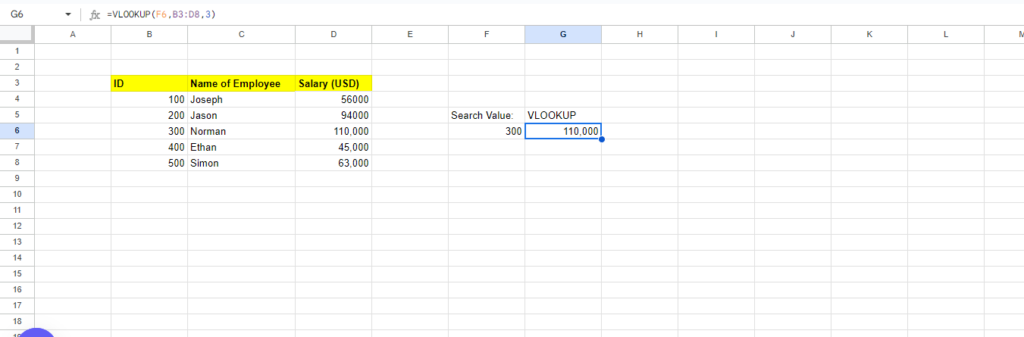
In this image, you can see how we have used VLOOKUP. There are a total of 3 columns where three separate data sets are present. Now let’s try to find the vertical data corresponding to the ID number 300 using VLOOKUP.

For that, you first need to move to a different cell and make a heading as VLOOKUP. Right on its left cell, write Search Value. Now, the search value is the ID against which we’re trying to find the corresponding vertical data. In the cell below the VLOOKUP title, we’ll start working on the formula.

  • We’ll start with =VLOOKUP(

  • Next, click on the cell where you want to get the result, that is in this case, F6 (right below the VLOOKUP cell).

  • Then add a comma, and choose the entire matrix which in our case ranges from B3 to D8.

  • Add another comma and then write the number of columns present in the entire data set which in our case is 3

  • And then close the bracket.

Therefore, the entire formula looks like:

=VLOOKUP(F6,B3:D8,3)

The result is 110,000 which is exactly the vertical data (salary) corresponding to the ID number 300.

3. SUMIF

 This is another important Excel formula that gives you the combined value of different cells but it is based on a certain criterion. When it comes to a large data set with multiple different numbers, you may not always want to get a combined value of all the cells. SUMIF allows you to get your desired result amidst the huge data. This is essential for complex data analysis. 

SUMIF Excel Formula

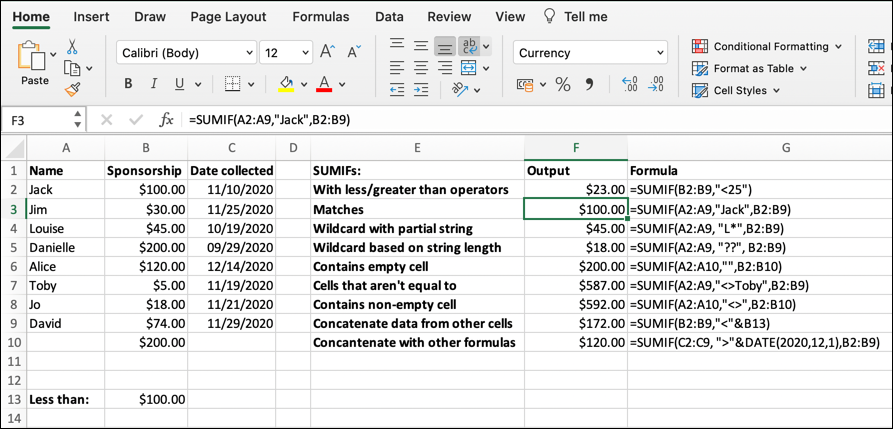
Let’s see how you can use SUMIF to obtain the data you are looking for. In the above illustration, you can see that there are various types of columns and another two separate columns ‘Output’ and ‘Formula’. So once you’re done with writing the data, choose any different cell and write ‘Formula’. Under this cell, we’ll be calculating the value using SUMIF.

  • The formula starts with, =SUMIF(

  • Now you have to choose the data set corresponding to which you have to choose the value. In this case, you have to select the entire range from B2:B9, i.e., the column with the name ‘Sponsorship’.

  • The next step is very crucial. In this section, we’ll choose the criterion barring which we want the result. Since the first criterion is with less/greater than operators and over here the operator is 25. So the formula is SUMIF(B2:B9,’<25’)

  • Now for the other operators, you will have to choose a different range. 

4. MINIFS/MAXIFS

This convenient equation not only discerns the lowest and highest values but also arranges them according to specific criteria. For instance, it can be applied to organize the ages of men and women in a sample, showcasing the values categorized by gender, thereby serving a dual purpose.

MINIFS/MAXIFS Excel Formula

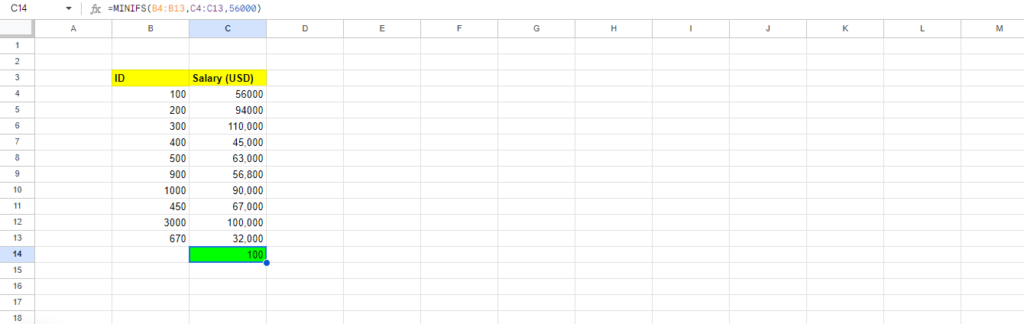
In the above example, you can see a cell highlighted in green that shows the result of 100. We wanted to find the lowest number corresponding to a salary is USD 56,000. 

So the formula goes like this:

=MINIFS(B4:B14, C4:C13,56000)

5. COUNTIF

THE COUNTIFS formula counts the numbers of how many times a value appears based on one criterion. The image below shows how COUNTIF is used by Data Analysts when they have a large number of data but they’re looking for a particular parameter. 

COUNTIF Excel Formula

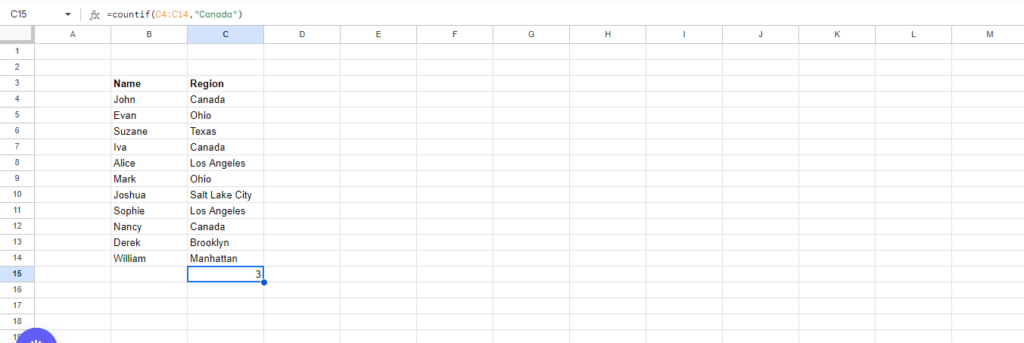
The first column under the title ‘Name’ has the name of the people and the next column ‘Region’ shows their hometown. In this scenario, we’re looking for how many people have their hometowns in Canada. Therefore, we have used the formula, =COUNTIF(C4:C14,”Canada”). You have to first select the entire that shows the hometown, i.e., the criterion we’re looking for and then have to mention the particular criterion we are seeking.

Conclusion

Now that you have got to know the Excel formulae that a Data Analyst often uses, you must start keeping track of these formulae. There are many other Excel formulae that Data Analysts use and if you want to know more about them, please drop your comment and share your feedback with us. 

Leave a Reply

Your email address will not be published. Required fields are marked *

Subscribe us