


Artificial Intelligence (AI) significantly influences the Microsoft Power BI dashboard in Data Visualization. A Microsoft Certified Data Analyst is getting thousands of meaningful and powerful ways to extract insights from data using pre-trained Machine Learning models and custom functions. Power BI has a steady update of tools and visuals with AI features, and often, it becomes tough for Data Analysts to keep updated. Microsoft Power BI, one of the most influential leaders in business intelligence and augmented analytics with the integration of AI is, therefore, doing wonders and becoming invisible concerning Data Visualization.
Power BI is More Than a Visualization tool
Microsoft Power BI has three major components, making it a modern enterprise BI platform.
- Data Visualization
- Data Modelling
- Data Preparation
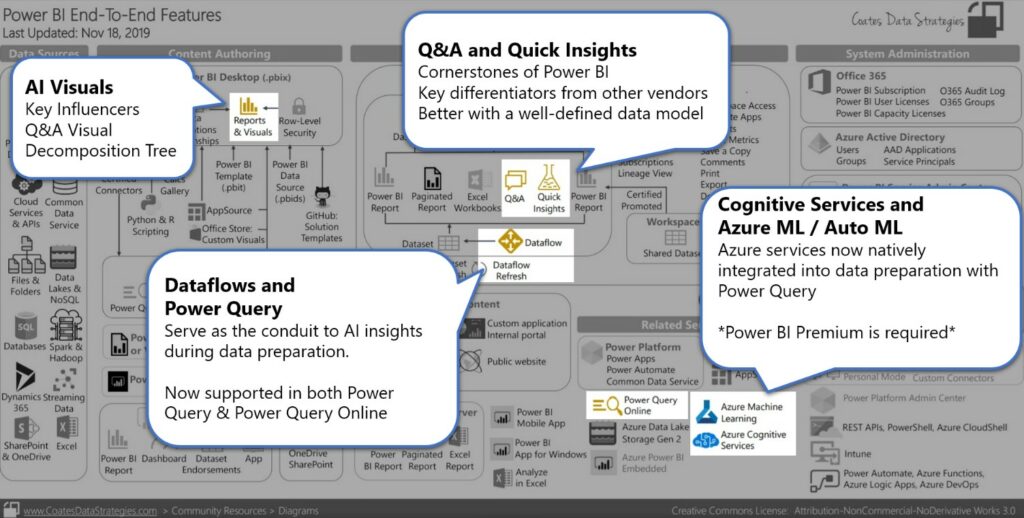
Source: Using AI in Microsoft Power B
The image above shows the specific regions of the Power BI platform where unique AI features are present. Let’s see the key AI features present in the Microsoft Power BI platform that make it superior to many other BI tools. Data Analysts mainly use the following traits of AI in Power BI.
Decomposition Tree
Data Analysts use Power BI to represent and interpret data easily, and with the three exclusive AI visuals, the entire procedure becomes seamless. The new AI features can be identified as bulb icons, and Data Analysts can utilize those to bake into traditional visuals, such as bar and column charts.
The decomposition tree is one such AI Visualization developed by the Power BI team. Decomposition or breaking down is a characteristic that shows a measure broken down by various attributes across different dimensions. This feature plays a great role during an ad hoc exploratory analysis of the data. Besides, Data Analysts use it for root-cause analysis with the help of the built-in AI feature.

There are two values: High Value and Low Value. Choosing any of these options will ask the feature to execute an “AI split,” subsequently identifying the next field to showcase either the highest or lowest value.
Insights
Quick Insights is one of the most straightforward AI functionalities present within Power BI. Primarily, all you need to do is click on your dataset and choose “Get quick insights.” Power BI will then employ diverse algorithms to seek out and pinpoint trends in your data. It’s crucial to note that having a well-structured data model enhances the effectiveness of Quick Insights, yielding more valuable results. After Quick Insights completes its algorithms, you can click “View Insights” to assess the visuals and decide whether you want to retain any by pinning them to a dashboard.
AutoML in Power BI
Automated Machine Learning in Power BI is often considered ‘Machine Learning with training wheels’ by both Data Analysts and Business Analysts. It supports Binary Prediction, General Classification, Regression models, Future forecasting, etc., and acts as a hands-on tool for analysts or developers who want to prototype functionality in Power BI.
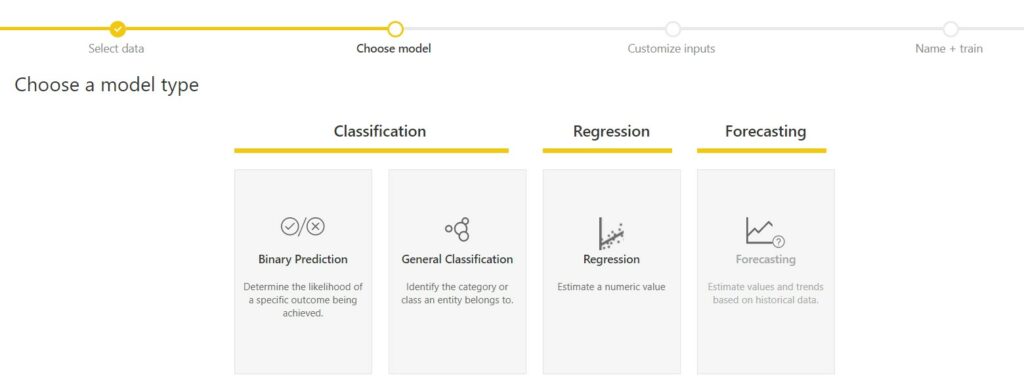
Source: Automated Machine Learning using AI in Power BI
Prime AI Features of Microsoft Power BI
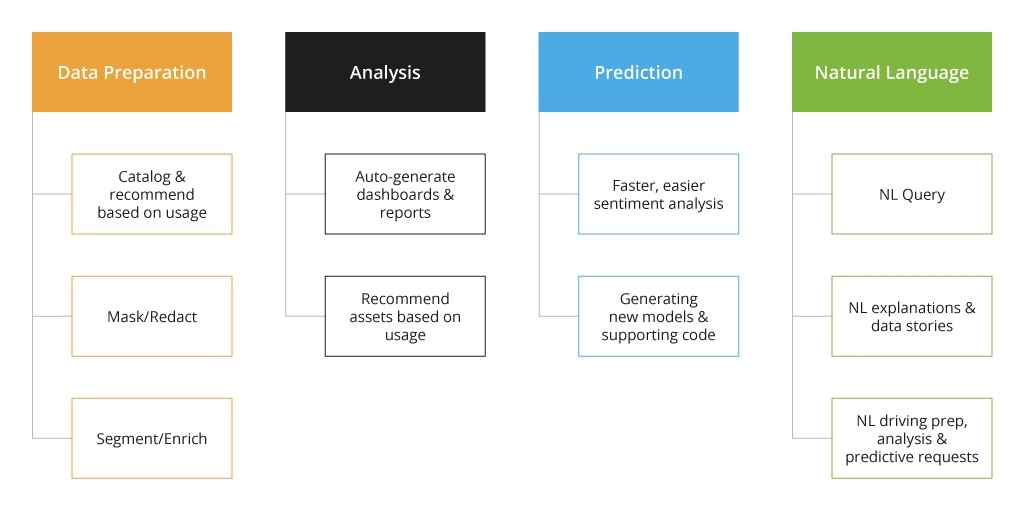
The figure below organizes the taxonomy in three ways:
- Feature type
- Grouped under a shared label
- Primary intended role, where tools in blue are for users, grey for developers, and black for data scientists
- A feature is in preview or generally available, shown by a white or grey fill, respectively
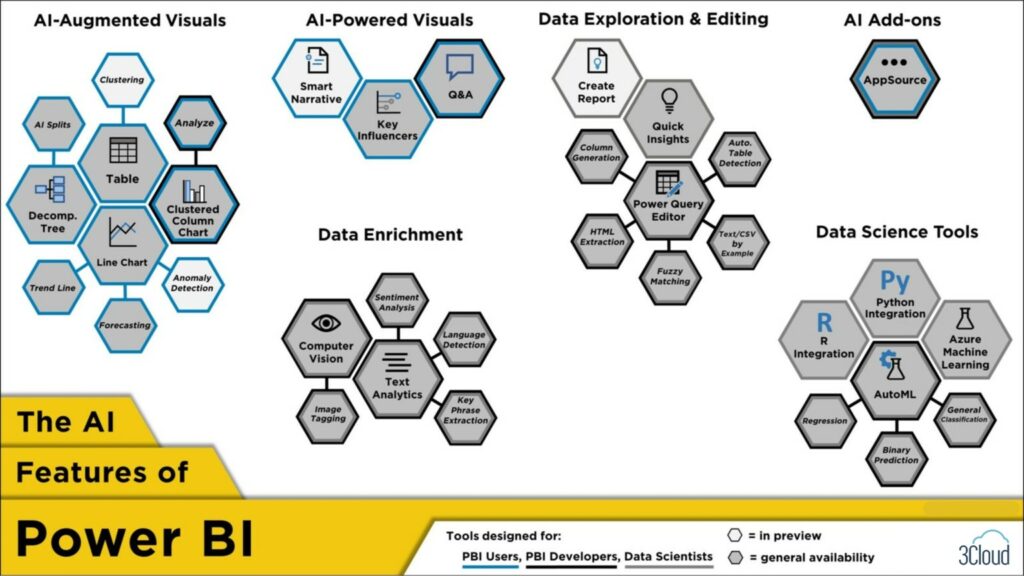
Source: AI features of Microsoft Power BI
AI Augmented Visuals
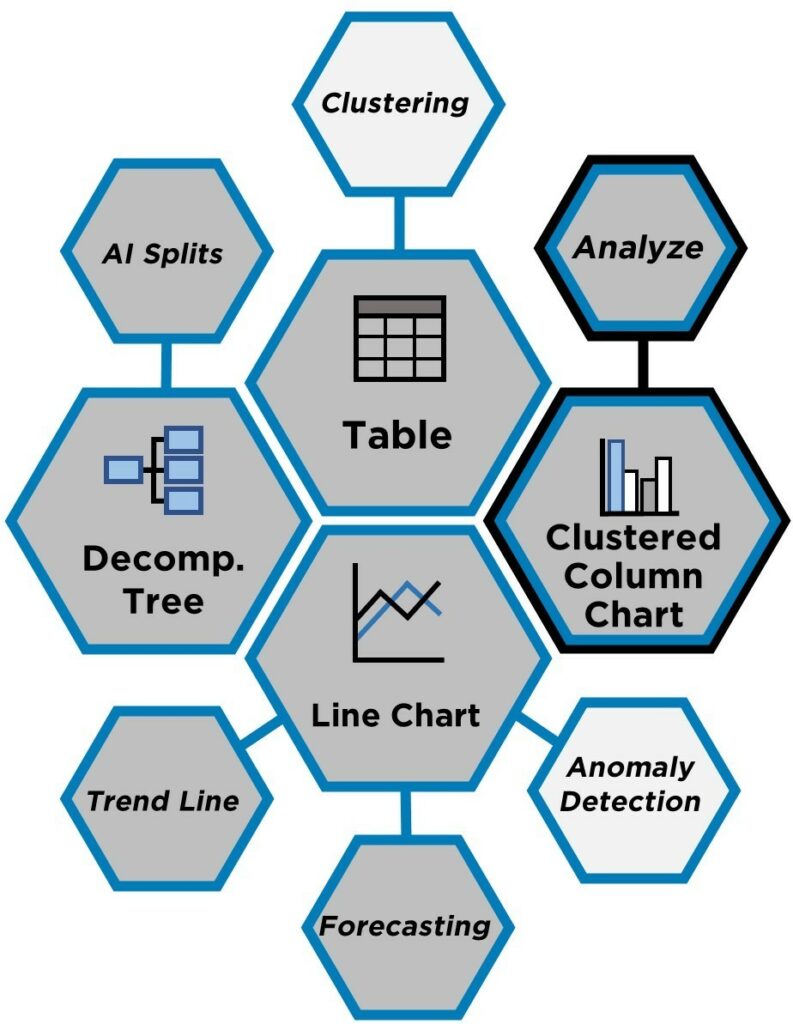
Using these special AI features in Microsoft Power BI started as regular visuals has now become invincible.
- The Decomposition Tree uses AI Splits to break down various traits and characteristics into high or low values according to the requirements of Data Analysts or developers.
- Clustering in Table and Scatter Charts groups similar observations together, saving the results as a new measure.
- Using AI-infused “Insights” appears in various visuals like the Clustered Column Chart. It helps explain visual changes or differences in distribution based on different slicers.
- Lastly, in the Line Chart, you can add a trend line, forecast a time series, or spot anomalies.
AI-integrated Visuals
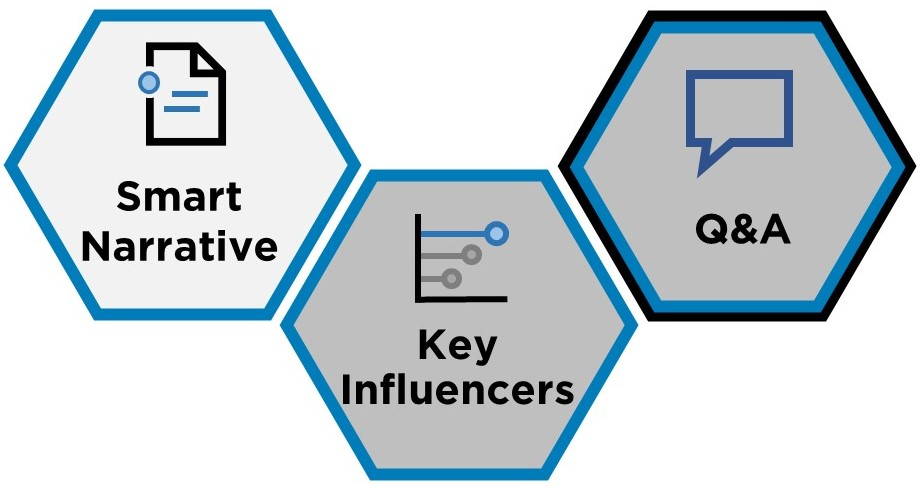
Smart Narrative, Key Influencers, and Q&A are the main visuals that are strongly AI-powered.
- Smart Narrative enables changing text descriptions for visuals
- Q&A lets users explore data and supports developers to generate visuals using text input.
- The Key Influencers visual identifies important influencers and top segments for a target outcome by performing a statistical and machine learning analysis in a user-friendly way.
Data Exploration and Editing
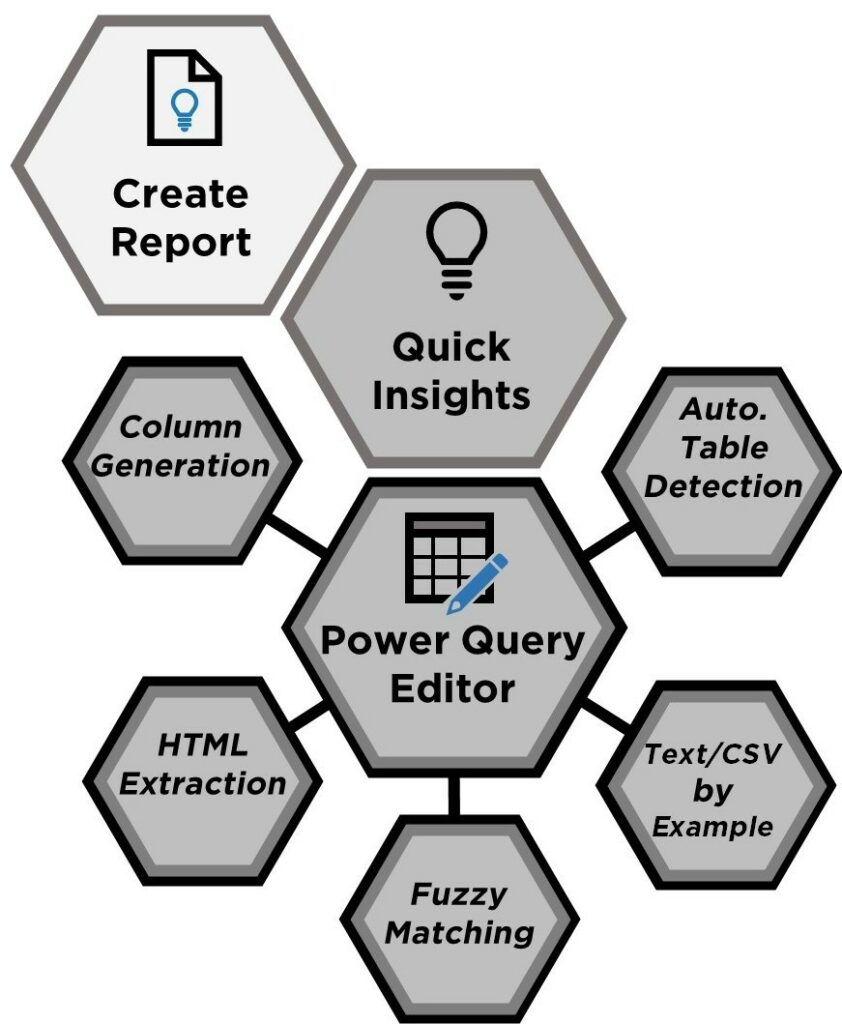
Create Report:
- Automatically generates a report on Power BI Service.
- Based on pasted data for quick report creation.
Quick Insights:
- Rapidly generates interesting visuals from data.
- Enables swift exploration of data.
Power Query Editor:
- Transforms data before loading into Power BI.
- Notable AI features include: Column generation helps to add new columns from examples. HTML extraction where analysts mine web data from examples. Fuzzy matching boosts merging nearly similar columns.
Data Extraction in Power Query:
- Extracts data from Text or CSV files using examples.
- Automatically detects tables from Excel or JSON files.
Target Audience:
- Primarily designed for Power BI developers.
- Data scientists can also benefit from the powerful tools within Power Query Editor.
Data Enrichment
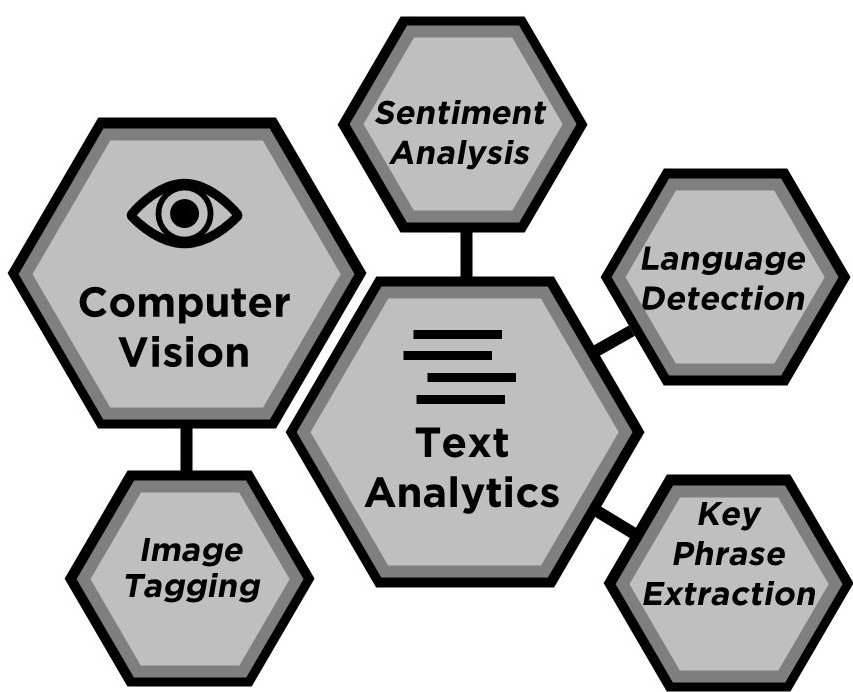
These features can be found in the “AI Insights” section of Power Query. They are designed for Developers, Data Scientists, Data Analysts, etc., and they augment data using Azure Cognitive Services within Power BI. Another key feature is Text Analytics which can input text data and output the detected language, key phrases, and sentiment. Computer Vision being a very special member of the Data Enrichment department can input images and output tags for common objects identified within those images.
AI Add-ons

While presented here as a unified feature, AI Add-ons serve as an entry point to an extensive array of publicly generated visuals tailored for diverse user groups. Numerous visuals within this collection integrate AI functionalities; however, providing documentation for each falls beyond the scope of this blog post.
Data Science Tools
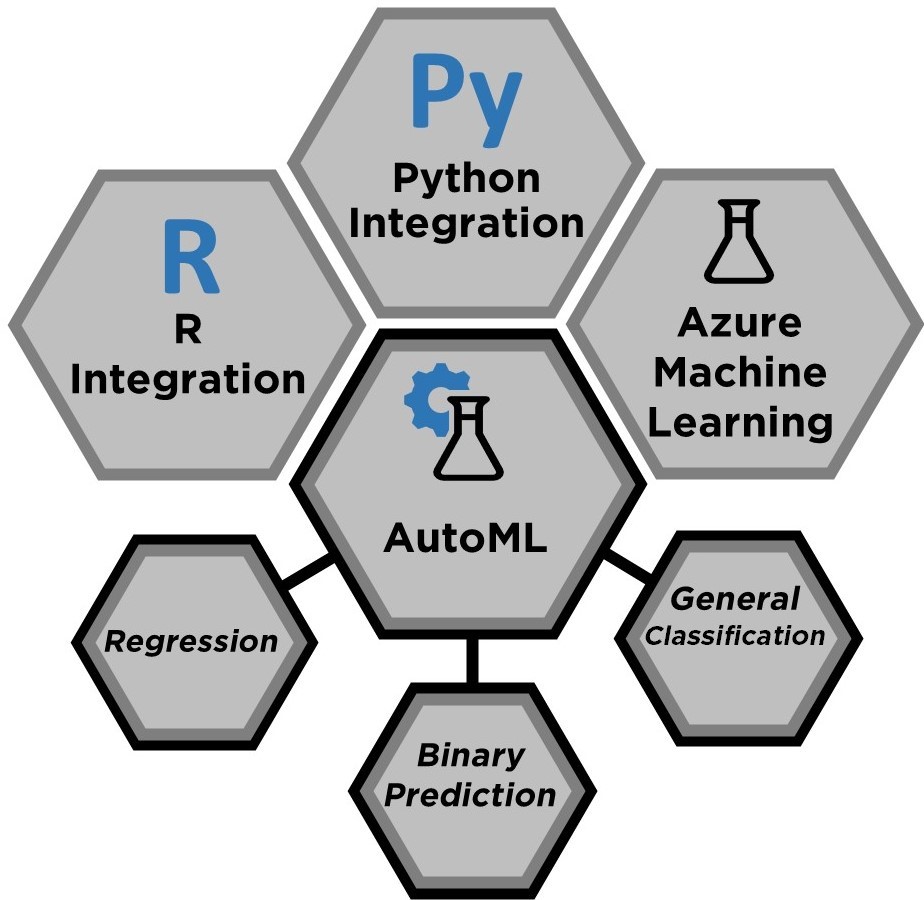
This is the treasure for Data Scientists that includes R Integration and Python Integration that can be used to:
- Collect Power BI data while using custom Data Science models like built-in R or Python,
- Conduct advanced text manipulations and calculations during the ingestion process, exceeding the capabilities of native Power BI functionality
- Craft personalized visualizations in Power BI
Case Studies where brands have integrated AI with Power BI service
AI-integrated Power BI service is a combination of these two technologies, which allows users to leverage AI capabilities within Power BI to enhance their data analysis and decision-making. Some of the latest case studies where companies have used AI-integrated Power BI services for data representation are:
Generative AI and Power BI
This case study by Infopulse, a global IT service provider, showcases how generative AI models can be used in Power BI to create original outputs, such as texts, visuals, audio, or code, based on the data provided. The case study also demonstrates how generative AI models can help with data querying, analysis, and visualization, as well as make data analytics more accessible and efficient.
Source: Generative AI Use Cases in Data Analytics and BI (infopulse.com)
Artificial Intelligence sample for Power BI
This case study by Microsoft provides a sample report for a fictitious company named Contoso, which uses various AI visuals in Power BI to understand their products and regions’ key contributors for revenue won/loss, identify the highest or lowest breakdown of revenue, and detect anomalies in their data. The case study also explains how to use the Key influencers, Decomposition tree, and Anomaly detection visuals in Power BI, and how they can help users discover new insights and inform their decision-making.
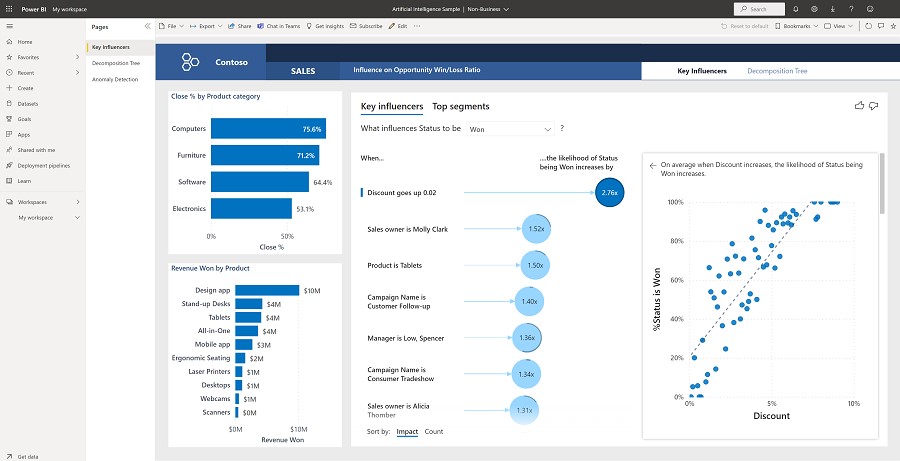
Source: Artificial Intelligence sample for Power BI: Take a tour – Power BI | Microsoft Learn
AI-powered Data Analytics & Insights
This case study by Bigint Solutions, a data analytics and AI consulting firm, presents a data analytics report for employee attrition analysis, using R programming and Power BI. The case study follows a methodical framework to understand the data, visualize it, and analyze the factors influencing attrition. The case study also uses AI techniques, such as clustering, decision trees, and random forests, to identify the patterns and trends in the data, and provide recommendations to reduce attrition.
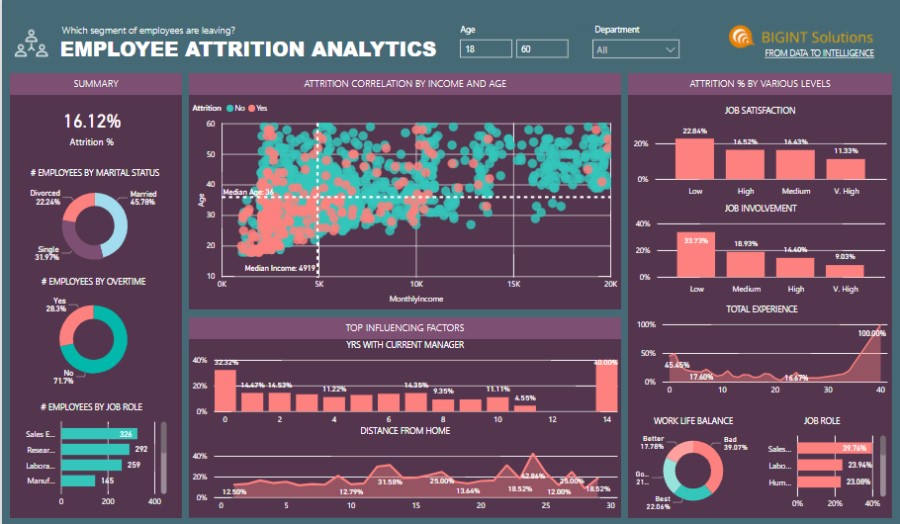
Source: Case Study | AI-powered Data Analytics; Insights | Business Data Insights (bigintsolutions.com)
Conclusion
AI-integrated Power BI service is a powerful tool that can help users create interactive and engaging reports and dashboards with superior Data Visualization and insights. Using AI in Microsoft Power BI, data professionals can utilize this feature to gather data and analyze it, followed by proper decision-making. Many case studies demonstrate how several companies and industries have used AI-integrated Power BI services for data representation and achieved their business goals. At Spoclear, we deliver Microsoft Power BI Data Analyst training for professionals and aspiring Data Analysts to gain a complete understanding of the Power BI tool and how it can be used with AI to get the best results